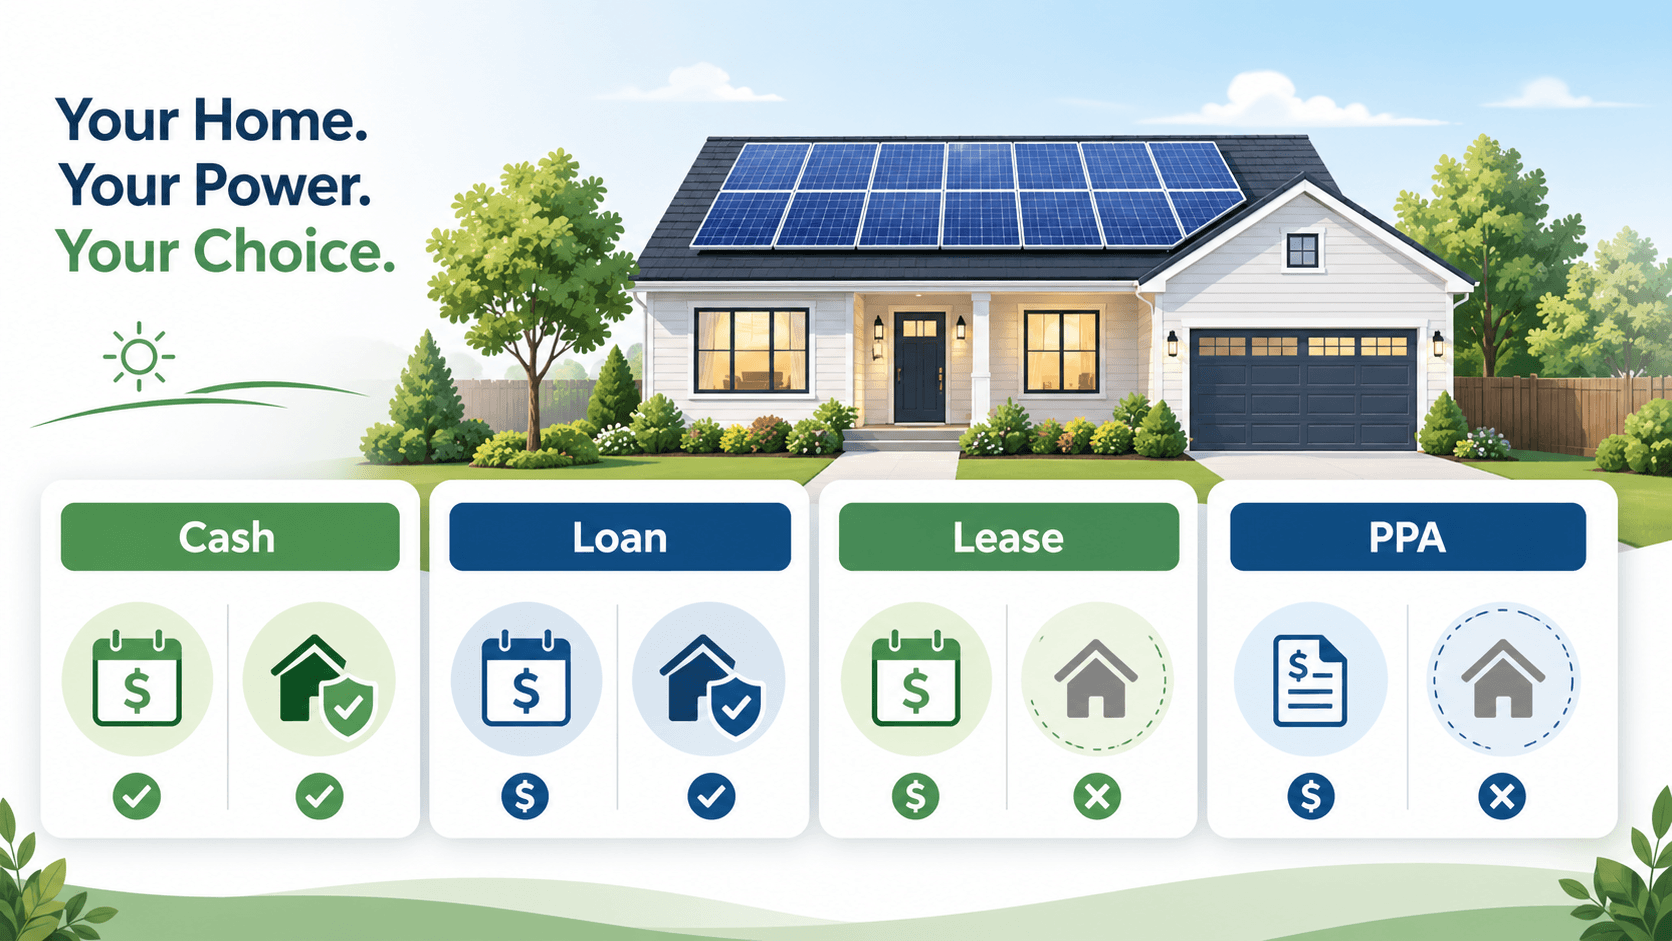
Choosing how to pay for solar can affect your savings almost as much as the solar panels themselves.
A system that looks affordable with a low monthly payment may cost more over time. A cash purchase may create stronger long-term savings but requires more money upfront. A lease or power purchase agreement may reduce responsibility, but it usually means you do not own the system.
That is why a clear solar financing comparison matters before you sign anything.
This guide compares the four common ways homeowners pay for solar:
- cash purchase
- solar loan
- solar lease
- solar power purchase agreement, or PPA
Each option can make sense in the right situation. The best choice depends on your upfront budget, electricity rate, incentives, ownership goals, credit profile, utility rules, roof conditions, contract terms, and how long you plan to stay in the home.
Before comparing installer quotes, use the MySolarROI solar ROI calculator to estimate how system cost, incentives, financing, electricity savings, and payback period may affect your long-term return.
Solar Financing Comparison: Quick Overview
The main difference between solar financing options is ownership.
With cash or a solar loan, you usually own the system. With a lease or PPA, a solar company or financing company typically owns the system installed on your home.
| Option | Who Usually Owns the System? | Upfront Cost | Long-Term Savings Potential | Key Tradeoff |
|---|---|---|---|---|
| Cash purchase | Homeowner | Highest | Often strongest | Requires more money upfront |
| Solar loan | Homeowner | Low to moderate | Can be strong, depending on loan terms | Interest and fees can reduce ROI |
| Solar lease | Solar company or financing company | Often low | Usually lower than ownership | You pay to use the system but usually do not own it |
| Solar PPA | Solar company or financing company | Often low | Depends on PPA rate and escalator | You buy solar electricity under a contract |
There is no single best solar financing option for everyone.
A cash purchase may be best for maximum long-term savings. A solar loan may be better if you want ownership but prefer to spread payments over time. A lease or PPA may appeal to homeowners who want lower upfront cost and less maintenance responsibility, but the contract must be reviewed carefully.
Why Solar Financing Affects ROI
Solar ROI depends on both sides of the equation:
- how much the system costs
- how much value it produces over time
Financing affects the cost side.
Loan interest, dealer fees, escalators, lease payments, PPA rates, and contract terms can change your real savings. Two homeowners can install similar systems and get very different financial outcomes because they chose different financing structures.
Before choosing a financing option, compare:
- total upfront cost
- cash price
- financed price
- APR or interest rate
- dealer fees
- monthly payment
- contract length
- ownership rights
- maintenance responsibility
- incentive eligibility
- system performance assumptions
- home sale or transfer terms
- total projected savings
For a full return calculation, read the how to calculate solar ROI guide.
Option 1: Cash Solar Purchase
A cash purchase means you pay for the solar system upfront and usually own it immediately.
This is often the simplest financing structure because there is no loan interest, lease payment, PPA rate, or financing company contract to include in the calculation.
Potential benefits of paying cash
- You usually own the solar system from day one.
- There are no loan interest charges.
- There are no solar lease or PPA escalators.
- Long-term savings potential may be stronger.
- Home sale may be simpler than with a lease or PPA.
- You may have more flexibility with equipment, installer, and system decisions.
Potential drawbacks of paying cash
- Requires the most money upfront.
- May not be realistic for many households.
- Ties up cash that could be used elsewhere.
- You are usually responsible for maintenance and warranty follow-up.
- Your ROI still depends on system cost, production, utility rules, and how long you stay in the home.
Cash may be attractive if you have available savings, want ownership, and care about long-term ROI more than short-term cash flow.
But cash is not automatically best for every homeowner. If using cash would create financial stress or prevent you from keeping an emergency fund, another option may be more practical.
Option 2: Solar Loan
A solar loan lets you own the system while spreading payments over time.
With a solar loan, the homeowner typically owns the panels, but also owes the loan balance. The details depend on the lender, the installer, the loan type, and whether the loan is secured or unsecured.
Potential benefits of a solar loan
- You usually own the system.
- Upfront cost may be lower than a cash purchase.
- You may be able to keep more cash available.
- Long-term savings may still be strong with reasonable loan terms.
- Ownership may preserve access to certain incentives if you qualify.
- After the loan is paid off, the system may continue producing savings.
Potential drawbacks of a solar loan
- Interest can reduce lifetime savings.
- Dealer fees or financing markups can raise the real system cost.
- Long loan terms can make monthly payments look lower while increasing total repayment.
- Some loans may assume incentive paydowns later.
- Loan transfer or payoff may matter if you sell the home.
- Missing payments can have credit or legal consequences depending on the loan type.
The CFPB has warned consumers to be careful with costly and complex solar loans, especially when salespeople emphasize quick decisions or monthly payments without clearly explaining the full contract. :contentReference[oaicite:3]{index=3}
Before accepting a solar loan, ask for:
- cash price
- financed price
- APR
- loan term
- monthly payment
- total repayment amount
- dealer fee or financing-related markup
- whether the loan is secured or unsecured
- whether payments change later
- whether the loan assumes an incentive paydown
- whether there are prepayment penalties
Use the solar panel cost 2026 guide to understand how the system price and financing structure work together.
Option 3: Solar Lease
In a typical solar lease, a solar company or financing company owns the system. You pay a fixed monthly amount to use the system or benefit from the electricity it produces.
Solar leases may appeal to homeowners who want lower upfront costs and less ownership responsibility. However, the long-term savings potential is often lower than owning the system.
Potential benefits of a solar lease
- Often little or no upfront cost.
- May include monitoring and maintenance.
- Can reduce electricity bills if the lease payment is lower than avoided utility costs.
- May be easier for homeowners who do not want to own equipment.
- System owner may handle some performance or repair responsibilities.
Potential drawbacks of a solar lease
- You usually do not own the system.
- The solar company may receive certain incentives, not you.
- Lease payments may increase over time if there is an escalator.
- Savings may be lower than with ownership.
- Contract terms can complicate selling the home.
- Buyout or transfer rules may be restrictive.
- You may have less flexibility to modify or remove the system.
FTC consumer guidance notes that solar options include buying a system, leasing a system, or signing an agreement to buy solar power, and homeowners should know what they are getting before agreeing to anything. :contentReference[oaicite:4]{index=4}
Option 4: Solar Power Purchase Agreement, or PPA
A solar PPA is a contract where a solar company usually installs, owns, and operates a solar system on your property. Instead of paying a fixed lease amount, you buy the electricity the system produces at a contract rate.
A PPA may sound simple, but the contract details matter.
Potential benefits of a solar PPA
- Often little or no upfront cost.
- You may pay only for energy the system produces.
- The solar company usually owns and maintains the system.
- The PPA rate may be lower than your utility rate at the start.
- It may provide savings without requiring system ownership.
Potential drawbacks of a solar PPA
- You usually do not own the system.
- The solar company may receive incentives.
- The PPA rate may increase over time if there is an escalator.
- Savings depend on the PPA rate compared with utility rates.
- The contract may be long-term.
- Home sale transfer, buyer approval, or buyout terms may be complicated.
- You may have less control over system decisions.
The U.S. Department of the Treasury warns that a PPA is a binding legal agreement and can be complex, so homeowners should review terms carefully and seek qualified help when needed. :contentReference[oaicite:5]{index=5}
Cash vs Loan vs Lease vs PPA: Detailed Comparison
The best solar financing option depends on what you value most: ownership, lower upfront cost, predictable payments, maximum long-term savings, or less maintenance responsibility.
| Question | Cash | Solar Loan | Solar Lease | Solar PPA |
|---|---|---|---|---|
| Do you usually own the system? | Yes | Yes, with loan balance | Usually no | Usually no |
| Upfront cost | Highest | Low to moderate | Often low | Often low |
| Monthly payment | No solar payment after purchase | Loan payment | Lease payment | Payment based on solar energy used or generated |
| Interest or escalator risk | No loan interest | Interest and possible fees | Possible annual escalator | Possible annual escalator |
| Incentive access | Homeowner may qualify | Homeowner may qualify | System owner may receive incentives | System owner may receive incentives |
| Maintenance responsibility | Homeowner / installer warranty | Homeowner / installer warranty | Often system owner | Often system owner |
| Long-term savings potential | Often strongest | Can be strong with fair loan terms | Usually lower than ownership | Depends on PPA rate and escalator |
| Home sale complexity | Usually simpler | Loan payoff or transfer may matter | Transfer or buyout may be needed | Transfer or buyout may be needed |
Mini Case Study: How Financing Can Change Payback
Here is a simplified example. These numbers are for illustration only and are not guaranteed.
Actual results depend on location, system cost, electricity rates, roof conditions, incentives, utility rules, financing terms, contract details, system production, and how long the homeowner stays in the home.
| Assumption | Cash Example | Loan Example |
|---|---|---|
| Gross system cost | $24,000 | $24,000 cash price / higher total repayment possible |
| Verified local rebate | $1,000 | $1,000 if eligible |
| Net cost before tax considerations | $23,000 | Depends on loan amount, fees, and interest |
| Estimated first-year savings | $1,800 | $1,800 before loan payments |
| Simple payback before financing cost | About 12.8 years | May be longer after financing cost |
| Ownership | Homeowner | Homeowner, with loan obligation |
Simple cash payback estimate:
$23,000 ÷ $1,800 = 12.8 years
With a loan, the simple payback can change because interest and fees increase the total amount paid. The monthly payment may still be lower than the electric bill reduction in some cases, but the long-term ROI depends on the full repayment amount.
For a lease or PPA, payback may not be calculated the same way because you may not own the system. Instead, compare:
- monthly lease payment or PPA rate
- expected utility bill savings
- annual escalator
- contract length
- buyout terms
- home sale transfer rules
- total projected savings over the contract
Use the MySolarROI calculator to test how system cost, savings, and financing assumptions affect solar payback and ROI before comparing quotes.
How Incentives Differ by Financing Type
Incentives can have a major impact on solar economics, but eligibility depends on current rules and ownership structure.
With a cash purchase or solar loan, the homeowner usually owns the system. That may preserve access to some homeowner-facing incentives if the homeowner qualifies.
With a lease or PPA, the solar company or financing company usually owns the system. That may mean the system owner, not the homeowner, receives certain incentives.
| Financing Type | Ownership | Incentive Question to Ask |
|---|---|---|
| Cash | Homeowner | Which incentives may I qualify for directly? |
| Solar loan | Homeowner, with loan balance | Do incentives reduce my cost, and does the loan assume a paydown? |
| Solar lease | Solar company or financing company | Who receives incentives and how are they reflected in my payment? |
| Solar PPA | Solar company or financing company | Are incentives reflected in the PPA rate? |
This article is educational and is not tax, legal, or financial advice. Incentive rules change and eligibility depends on your specific situation. Verify current rules with official sources or a qualified professional before relying on incentives in your solar decision.
You can test incentive assumptions with the solar tax credit calculator, but do not treat calculator results as tax advice.
How Solar Financing Affects Selling Your Home
Solar financing can affect a future home sale.
An owned system may be simpler to explain to buyers, especially if the system is paid off. A loan may need to be paid off, transferred, or handled at closing depending on the loan agreement.
Leases and PPAs may require:
- buyer approval
- contract transfer
- credit qualification
- buyout review
- system removal terms
- coordination with the solar company
Before signing a lease or PPA, ask exactly what happens if you sell your home.
| Question | Why It Matters |
|---|---|
| Can the contract transfer to a buyer? | Some buyers may not want or qualify for the contract |
| Is there a buyout option? | You need to know the cost and timing |
| Can the system be removed? | Removal may be restricted or expensive |
| What happens if the buyer refuses? | You need to understand your obligations |
| Is there a UCC filing or other notice? | This can matter during mortgage or sale paperwork |
If you may sell the home soon, review the contract with extra care before choosing a lease, PPA, or long-term loan.
Solar Financing Questions to Ask Before Signing
Before choosing any solar financing option, ask these questions:
- Who owns the solar system?
- What is the cash price?
- What is the financed price?
- What is the APR or interest rate?
- What is the total repayment amount?
- Is there a dealer fee or financing-related markup?
- Is there an annual escalator?
- How long is the contract?
- Who receives incentives?
- Who handles maintenance?
- What happens if the system underproduces?
- What happens if I sell my home?
- Can I prepay, buy out, or cancel?
- Are there liens, filings, or transfer requirements?
- What costs are not included?
If the answer is unclear, ask for the contract language in writing. Do not rely only on verbal explanations.
Common Solar Financing Mistakes
| Mistake | Why It Can Hurt You | Better Approach |
|---|---|---|
| Comparing only monthly payment | May hide higher total cost or long contract terms | Compare total repayment, ROI, and payback |
| Ignoring cash price | You may not see financing markups | Ask for cash and financed prices |
| Assuming low APR means low cost | Dealer fees may be built into the price | Check total repayment and price difference |
| Not reading escalator terms | Lease or PPA payments may rise over time | Review annual increases and total contract cost |
| Assuming you receive all incentives | Third-party-owned systems may handle incentives differently | Ask who receives incentives and how they affect pricing |
| Ignoring home sale terms | Transfer rules can complicate a sale | Review buyer transfer, buyout, and removal clauses |
| Trusting verbal promises | Only the written contract controls | Get every important promise in writing |
Which Solar Financing Option Is Best?
The best solar financing option depends on your priorities.
| Your Priority | Option to Compare First | Why |
|---|---|---|
| Highest long-term savings | Cash purchase | No loan interest or third-party ownership |
| Ownership with lower upfront cost | Solar loan | You may own the system while spreading payments |
| Lower responsibility for maintenance | Lease or PPA | System owner may handle some maintenance |
| Lowest upfront cost | Loan, lease, or PPA | Depends on terms and qualification |
| Simpler home sale later | Cash or paid-off owned system | Usually easier than transferring a lease or PPA |
| Best ROI | Usually cash or transparent low-cost loan | But only if system cost and savings assumptions are strong |
Cash often provides the strongest long-term ROI because there are no financing costs. A transparent, low-cost loan can also work well. Leases and PPAs may reduce upfront cost, but they often limit long-term upside and ownership flexibility.
Still, the right answer depends on the full contract, not just the label.
External Sources to Check
Before choosing a solar financing option, review official consumer guidance and verify contract assumptions.
- FTC consumer advice on solar power for your home
- CFPB issue spotlight on solar financing
- CFPB consumer advisory on solar loans
- Energy.gov homeowner guide to solar financing
- U.S. Treasury consumer advisory on PPAs
FAQ About Solar Financing
What is the best way to finance solar panels?
The best way to finance solar panels depends on your budget, credit profile, ownership goals, electricity rate, incentives, and how long you plan to stay in the home. Cash often offers strong long-term savings, while a transparent solar loan may work for homeowners who want ownership with lower upfront cost.
Is it better to buy or lease solar panels?
Buying solar panels usually provides more ownership control and stronger long-term savings potential. Leasing may reduce upfront cost and maintenance responsibility, but you usually do not own the system and may have less flexibility when selling the home.
Do I own the panels with a solar loan?
Usually, yes. With a solar loan, homeowners typically own the system while repaying the loan. However, the details depend on whether the loan is secured or unsecured and what the contract says.
What is the difference between a solar lease and a PPA?
With a solar lease, you typically pay a fixed monthly amount to use the system. With a PPA, you usually pay for the electricity the system produces at a contract rate. In both cases, the solar company or financing company typically owns the system.
Are solar PPAs a good deal?
A solar PPA can be a good deal if the PPA rate is lower than your utility rate, the escalator is reasonable, and the contract terms are fair. Compare total projected savings, not just the first-year rate.
Can solar financing affect selling my home?
Yes. Owned systems are usually simpler, especially if paid off. Loans may need payoff or transfer review. Leases and PPAs may require buyer approval, contract transfer, buyout review, or other steps before the sale can close.
Does solar financing affect incentives?
It can. With cash or a solar loan, the homeowner usually owns the system and may qualify for certain incentives if eligible. With a lease or PPA, the system owner may receive incentives. Always verify current rules before relying on incentives.
What should I compare before choosing solar financing?
Compare ownership, cash price, financed price, APR, total repayment, monthly payment, escalators, contract length, incentive treatment, maintenance responsibility, home sale terms, and estimated solar ROI.
Conclusion
This solar financing comparison comes down to one central tradeoff: ownership versus flexibility.
Cash usually gives the highest long-term savings, but it requires the most money upfront. A solar loan keeps ownership in your hands while spreading payments over time. A lease or PPA can reduce upfront cost and maintenance responsibility, but you usually give up ownership, some savings potential, and some flexibility when selling your home.
Before choosing cash, a solar loan, a lease, or a PPA, compare the full contract, not just the monthly payment.
Review the cash price, financed price, APR, dealer fees, escalators, incentive treatment, maintenance responsibility, home sale terms, and total projected savings.
Then run your numbers with the MySolarROI solar ROI calculator to estimate payback period, monthly cash flow, and long-term savings before you compare installer quotes.