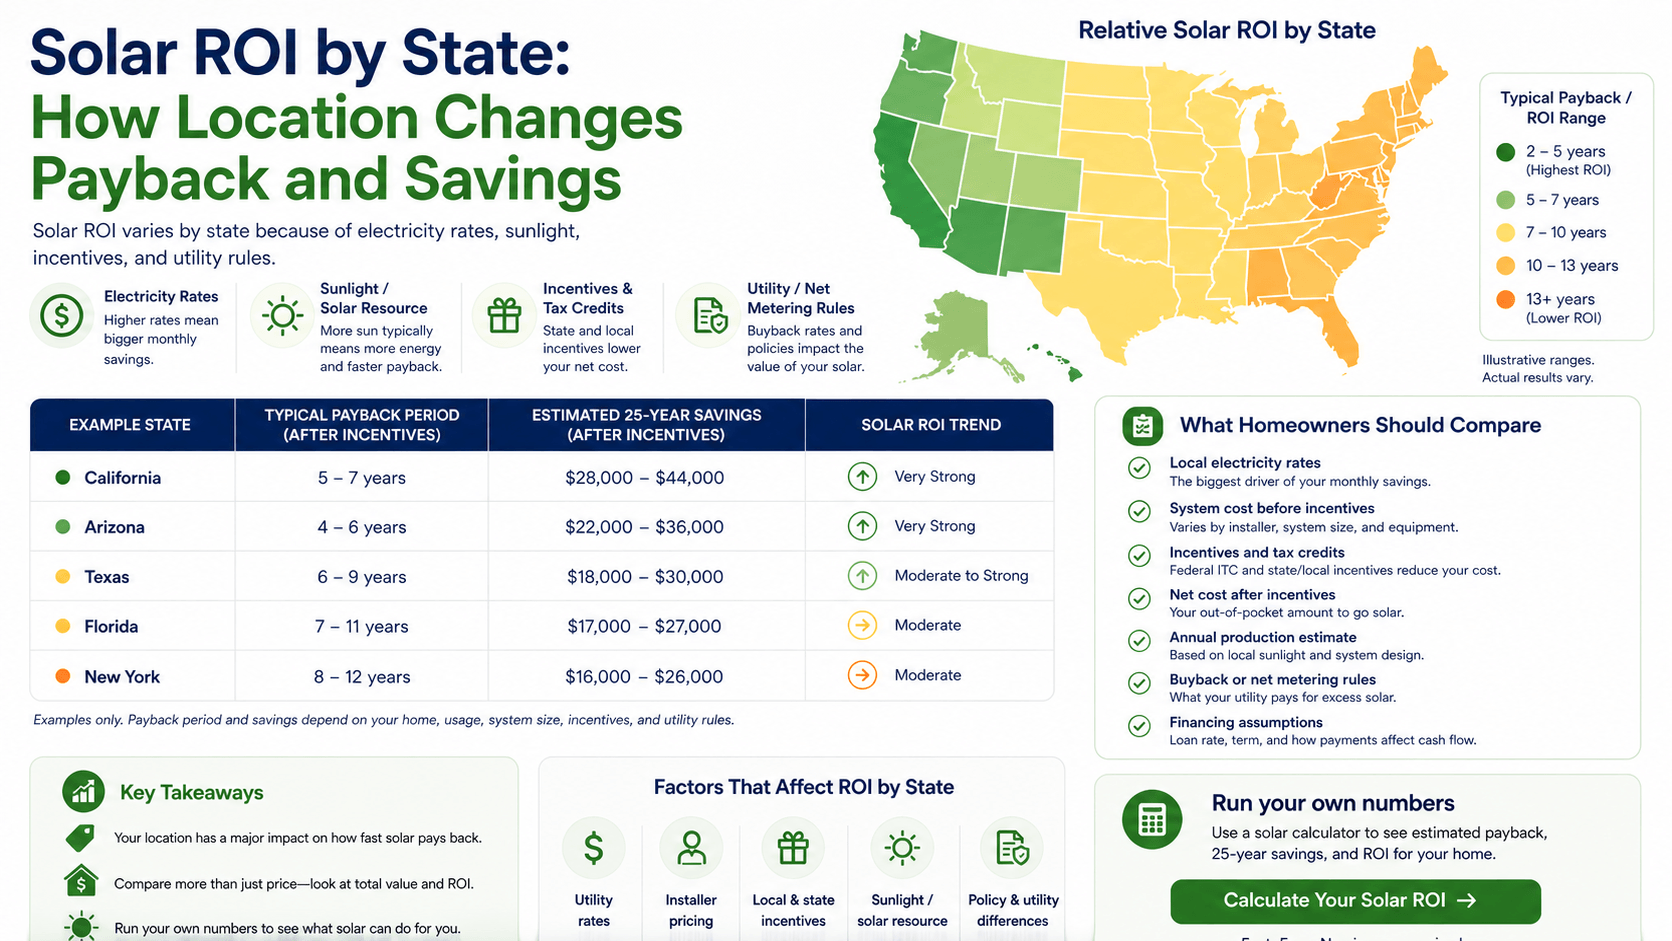
If you are comparing solar ROI by state, the most important thing to understand is that location changes almost every part of the solar calculation.
The same solar panel system can have a short payback period in one state and a much longer payback period in another. That does not happen because the panels are completely different. It happens because electricity rates, sunlight, incentives, utility rules, installation costs, financing, and net metering policies vary by location.
A state with high electricity rates may create stronger savings from each kilowatt-hour of solar electricity. A state with strong incentives may reduce the net system cost. A state with weak export credits may reduce the value of extra solar energy sent to the grid.
That is why state-level solar ROI should be calculated carefully, not guessed from a national average.
This guide explains how to compare solar ROI by state, what inputs matter most, and how homeowners can estimate payback and long-term savings using realistic assumptions.
Before comparing installer quotes, use the MySolarROI solar ROI calculator to test your state, electricity rate, system cost, incentives, financing, and utility rules.
Solar ROI by State: Why Location Matters
Solar ROI measures the estimated financial return from a solar panel system compared with the net cost of installing it.
A simplified formula is:
Solar ROI = lifetime net savings ÷ net solar system cost × 100
State matters because both sides of that formula change by location.
| State-Level Factor | How It Affects Solar ROI |
|---|---|
| Electricity rates | Higher rates can increase the value of solar bill savings |
| Solar production | Sunnier locations may produce more electricity per kW installed |
| Installed cost | Labor, permitting, installer competition, and equipment pricing vary by state |
| State incentives | Rebates, tax credits, exemptions, and utility programs can reduce net cost |
| Net metering or export credits | Utility rules determine how excess solar energy is valued |
| Financing market | Loan terms, dealer fees, and lease/PPA offers vary by installer and region |
| Roof conditions | Snow, shade, roof pitch, roof type, and local building rules affect design |
This is why two homeowners with the same system size may see very different returns.
The Main Formula for Solar ROI by State
To estimate solar ROI by state, start with the same basic formula, then use state-specific inputs.
Solar ROI = lifetime net savings ÷ net system cost × 100
For payback period, use:
Solar payback period = net system cost ÷ annual electricity bill savings
The challenge is choosing realistic inputs.
| Input | State-Specific Source or Method | Why It Matters |
|---|---|---|
| Electricity rate | Your utility bill or EIA state data | Determines value of avoided grid electricity |
| Solar production | NREL PVWatts or installer production model | Estimates annual kWh production |
| Installed cost | Local installer quotes | Determines upfront cost to recover |
| Incentives | DSIRE, state energy office, local utility | May reduce net system cost if you qualify |
| Net metering | Utility tariff or state public utility commission | Determines value of exported solar electricity |
| Financing | Installer, lender, or lease/PPA contract | Interest, fees, and escalators can reduce ROI |
For the full return formula, read the how to calculate solar ROI guide.
Electricity Rates: The Biggest State-Level ROI Driver
Electricity rates are one of the strongest reasons solar ROI varies by state.
If you pay a high price per kilowatt-hour, each kWh of solar electricity that offsets grid power may be more valuable. If you pay a low price per kWh, the same solar production may save less money.
EIA publishes average electricity price data by state and end-use sector, including residential electricity prices. Those state averages are useful context, but your actual utility bill is usually the best input for your own calculation. :contentReference[oaicite:1]{index=1}
| Annual Solar Offset | Electricity Value | Estimated Annual Value |
|---|---|---|
| 9,000 kWh | $0.12/kWh | $1,080 |
| 9,000 kWh | $0.18/kWh | $1,620 |
| 9,000 kWh | $0.28/kWh | $2,520 |
This simplified example shows why states with higher electricity rates often have stronger solar savings potential. However, high rates alone do not guarantee strong ROI. System cost, net metering, incentives, and financing still matter.
Solar Production by State
Solar production also changes by state because sunlight, weather, roof orientation, roof tilt, shade, snow, temperature, and system design vary by location.
A 7 kW system in Arizona may not produce the same annual kWh as a 7 kW system in Maine, Oregon, or Michigan. Even within the same state, production can differ by roof direction, shade, and local weather patterns.
NREL’s PVWatts Calculator estimates the energy production of grid-connected photovoltaic systems and allows homeowners, installers, and building owners to develop performance estimates for potential PV installations. :contentReference[oaicite:2]{index=2}
| Production Factor | How It Affects ROI |
|---|---|
| Peak sun hours | More usable sunlight can increase annual production |
| Roof orientation | South-facing roofs often perform well in many U.S. locations |
| Shade | Shade can reduce output and weaken payback |
| Snow | Snow can reduce winter production in some regions |
| Temperature | High temperatures can reduce panel efficiency somewhat |
| System losses | Wiring, inverter, dust, and equipment losses reduce real output |
When comparing solar ROI by state, do not use only the state name. Use a production estimate for your ZIP code, roof, and system design.
Solar Panel Cost by State
Installed solar cost also varies by state.
State-level solar cost can change because of:
- local labor costs
- permitting requirements
- interconnection rules
- installer competition
- roof types
- electrical upgrade requirements
- battery adoption
- sales and customer acquisition costs
- financing structures
A lower installed price can shorten payback. A higher installed price can lengthen payback unless the state also has high electricity rates, strong incentives, or favorable utility rules.
For cost comparison, read the solar panel cost by state guide and the solar panel cost 2026 guide.
Incentives by State
State and utility incentives can make a major difference in solar ROI, but they change often and must be verified.
Depending on your location, incentives may include:
- state rebates
- utility rebates
- local incentives
- state tax credits
- property tax exemptions
- sales tax exemptions
- renewable energy credit programs
- battery incentives
- special financing programs
DSIRE describes itself as a comprehensive source of information on incentives and policies that support renewable energy and energy efficiency in the United States. Use it as a starting point, then confirm details with your state energy office, local utility, or a qualified professional. :contentReference[oaicite:3]{index=3}
For 2026 projects, homeowners should also be careful with federal tax credit assumptions. IRS guidance states that the Residential Clean Energy Credit equals 30% for qualified clean energy property installed from 2022 through December 31, 2025, and is not available for property placed in service after December 31, 2025. :contentReference[oaicite:4]{index=4}
For more detail, read the federal solar tax credit 2026 guide and the solar tax credit calculator guide.
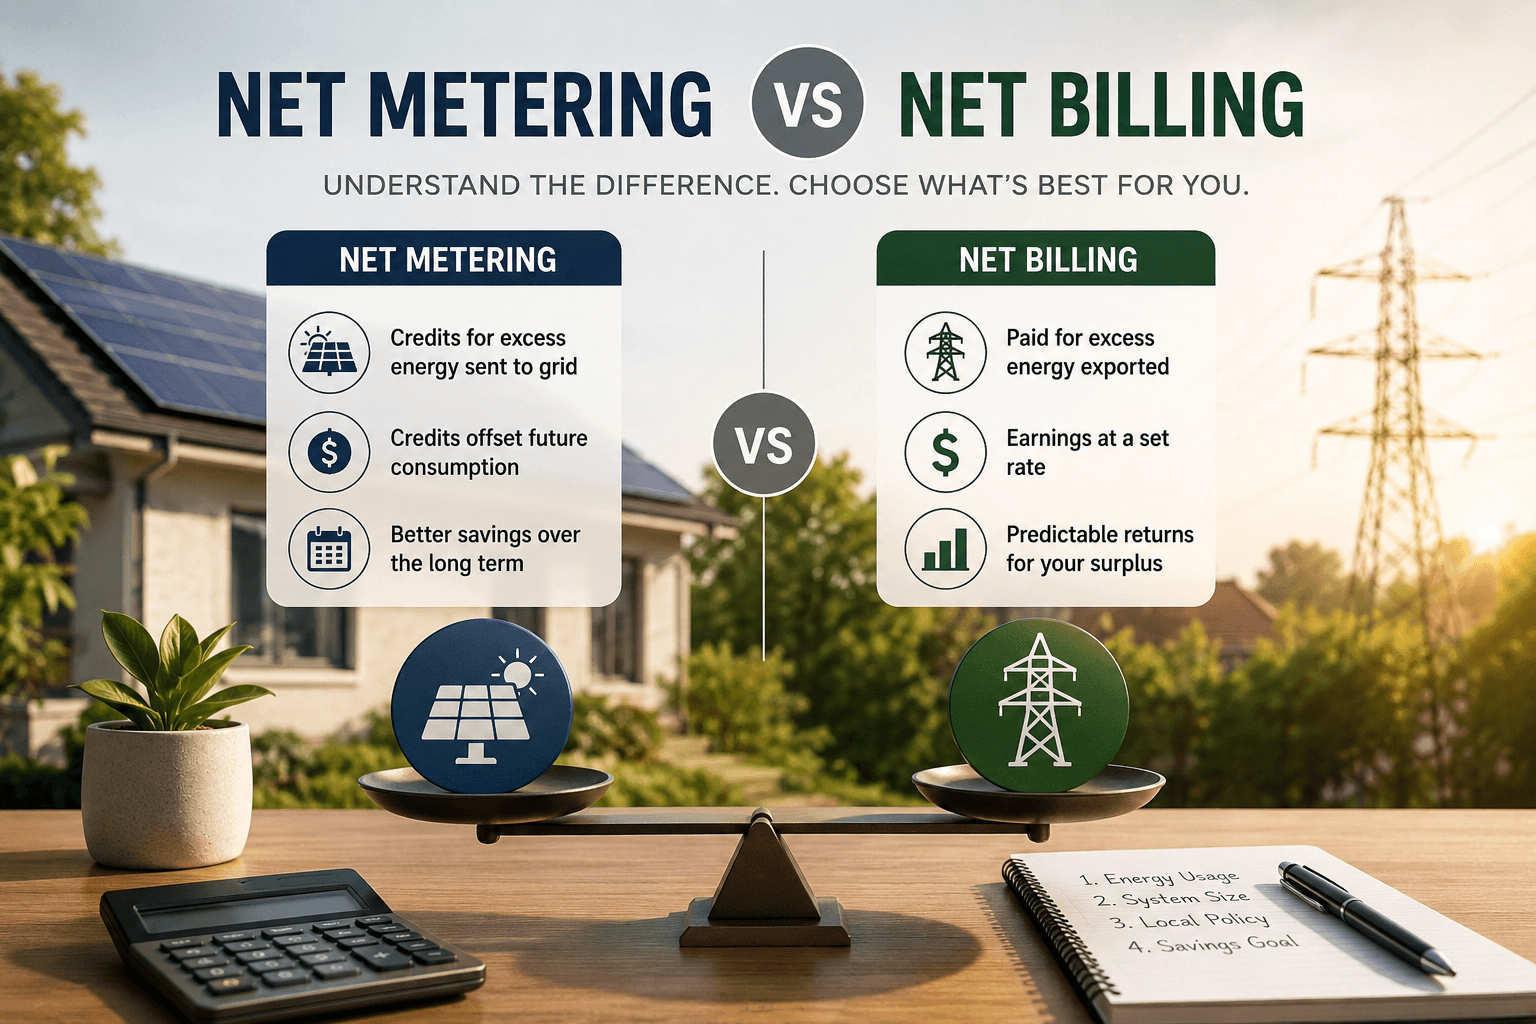
Net Metering and Export Credits by State
Net metering and export credit rules can strongly affect solar ROI by state.
When solar panels produce more electricity than your home uses, that extra electricity may be sent to the grid. Your utility may credit that exported energy, but the value of the credit depends on your utility rules.
| Export Credit Type | How It Can Affect ROI |
|---|---|
| Full retail net metering | May increase savings and shorten payback |
| Net billing | ROI depends on the separate export credit rate |
| Avoided cost credit | Can reduce the value of exported solar electricity |
| Time-of-use export rates | Production timing and battery strategy may matter more |
| Low or limited export credit | System sizing and self-consumption become more important |
A state may have generally favorable solar economics, but your specific utility tariff controls your actual bill treatment. Always check your local utility’s current rules before relying on a savings estimate.
Read the net metering explained guide before assuming every exported kWh gets full retail credit.
Mini Case Study: Same System, Different State ROI
Here is a simplified example. These numbers are for illustration only and are not guaranteed.
Actual results depend on your state, utility, roof, system cost, incentives, electricity rate, net metering rules, financing, installer pricing, and actual solar production.
| Assumption | State A | State B |
|---|---|---|
| System size | 8 kW | 8 kW |
| Gross installed cost | $26,000 | $28,000 |
| Verified state/utility incentive | $500 | $2,500 |
| Net cost before tax considerations | $25,500 | $25,500 |
| Estimated annual production | 10,000 kWh | 10,000 kWh |
| Effective electricity value | $0.14/kWh | $0.25/kWh |
| Estimated annual savings | $1,400 | $2,500 |
| Simple payback | 18.2 years | 10.2 years |
Simple payback calculations:
$25,500 ÷ $1,400 = 18.2 years
$25,500 ÷ $2,500 = 10.2 years
In this example, both states have the same net cost before tax considerations. But State B has a shorter payback period because the effective electricity value is higher.
This is why solar ROI by state is not just a cost comparison. It is a cost, production, utility, incentive, and rate comparison.
Use the MySolarROI calculator to test your own state, utility rate, incentives, production estimate, and system cost before comparing installer quotes.
Solar ROI by State: What to Compare
To compare solar ROI by state, use a consistent framework.
| Comparison Item | Question to Ask |
|---|---|
| Electricity rate | What does your utility charge per kWh? |
| Annual usage | How many kWh does your home use per year? |
| Solar production | How many kWh will the system produce annually? |
| System cost | What is the gross installed cost? |
| Cost per watt | How does the quote compare to similar local systems? |
| Verified incentives | Which state, local, or utility incentives apply? |
| Export credit | How does your utility value excess solar? |
| Financing | What is the cash price vs financed price? |
| Battery | Is storage included, and does it improve ROI or mainly resilience? |
| Payback period | How long until savings recover net cost? |
If a state-level article gives a simple ranking without showing these assumptions, treat it as a starting point, not a final answer.
State-Level Solar ROI Red Flags
Be cautious when a solar ROI estimate:
- uses only national averages
- does not show electricity rate assumptions
- does not explain net metering or export credits
- automatically applies outdated incentives
- ignores financing costs
- does not separate cash price from financed price
- does not show annual production
- does not account for roof shade or orientation
- claims guaranteed savings
Solar ROI is an estimate. A good estimate should show the assumptions clearly.
Best and Worst States for Solar ROI: Why Rankings Can Mislead
Many articles try to rank the best and worst states for solar. Those rankings can be useful for quick context, but they can also mislead homeowners.
A state ranking may use average installation cost, average electricity price, average sunlight, average incentives, or policy scores. But your actual result depends on your home and your utility.
| Ranking Factor | Why It May Not Match Your Home |
|---|---|
| Average state electricity rate | Your utility rate plan may differ from the state average |
| Average installed cost | Your roof, equipment, and installer pricing may differ |
| Average sunlight | Your roof may be shaded or face a different direction |
| State incentive summary | Your utility or income eligibility may differ |
| Net metering score | Your exact tariff may depend on utility and installation date |
Use rankings to identify what to investigate. Do not use them as a substitute for your own quote-level ROI calculation.
How Financing Changes Solar ROI by State
Financing can change solar ROI in any state.
A state with strong electricity savings can still produce weak ROI if the loan includes high interest, dealer fees, or a much higher financed price.
Before accepting a solar loan, lease, or PPA, ask:
- What is the cash price?
- What is the financed price?
- What is the APR?
- What is the loan term?
- Are dealer fees included?
- What is the total repayment amount?
- Does the payment assume an incentive paydown?
- Does the lease or PPA include an annual escalator?
- Who receives incentives?
- What happens if I sell my home?
Use the solar financing comparison guide before comparing ROI across financing options.
How to Calculate Solar ROI for Your State
Use this step-by-step process:
- Find your annual electricity usage from your utility bill.
- Find your actual electricity rate or effective rate.
- Estimate solar production using PVWatts or installer production data.
- Get at least two or three local installer quotes.
- Separate cash price from financed price.
- Verify state, local, and utility incentives.
- Check your utility’s net metering, net billing, or buyback rules.
- Estimate annual bill savings.
- Calculate simple payback period.
- Estimate lifetime savings and solar ROI.
- Run conservative, base, and optimistic scenarios.
Do not rely only on one optimistic quote. Compare the assumptions behind each estimate.
Common Mistakes When Comparing Solar ROI by State
| Mistake | Why It Can Mislead You | Better Approach |
|---|---|---|
| Assuming high sunlight means best ROI | Electricity rates and policy rules also matter | Compare cost, rates, production, and credits together |
| Using state averages only | Your utility and roof may differ | Use your utility bill and roof-specific production estimate |
| Ignoring net metering | Export credits can change savings significantly | Check your utility tariff |
| Assuming incentives apply | Eligibility may vary | Verify current programs before using them |
| Ignoring financing costs | Loans, leases, and PPAs can reduce ROI | Compare cash and financed scenarios |
| Comparing different system sizes | Payback may not be comparable | Normalize by system size, production, and cost per watt |
| Forgetting roof conditions | Shade or roof work can weaken returns | Ask for shade and roof suitability analysis |
External Sources to Check
Before relying on a state-level solar ROI estimate, verify assumptions with reputable sources.
- EIA average electricity prices by state
- NREL PVWatts solar production calculator
- DSIRE incentive and policy database
- IRS Residential Clean Energy Credit guidance
- Your state energy office
- Your state public utility commission
- Your local utility’s current net metering, net billing, or solar buyback tariff
FAQ About Solar ROI by State
Which state has the best solar ROI?
There is no single answer for every homeowner. Solar ROI depends on electricity rates, solar production, system cost, incentives, net metering rules, financing, roof conditions, and actual energy usage. A state ranking can help with research, but your utility and quote matter more.
Why does solar ROI vary by state?
Solar ROI varies by state because electricity rates, solar production, installation costs, incentives, utility policies, permitting rules, and financing options vary by location. These factors change both system cost and long-term savings.
Do high electricity rates improve solar ROI?
Often, yes. Higher electricity rates can increase the value of each kWh of solar electricity that offsets grid power. However, ROI also depends on system cost, export credits, incentives, financing, and roof production.
Do sunny states always have the best solar ROI?
Not always. Sunlight helps production, but solar ROI also depends on electricity rates, installed cost, incentives, and net metering rules. A less sunny state with high electricity rates and strong incentives may still have attractive solar economics.
How do incentives affect solar ROI by state?
State, local, and utility incentives can reduce net solar cost if you qualify. Lower net cost can improve payback and ROI. However, incentive rules change, so you should verify current eligibility before including incentives in your calculation.
How does net metering affect solar ROI by state?
Net metering or export credit rules affect how much value you receive for excess solar electricity sent to the grid. Strong export credits can improve savings, while low export credits can lengthen payback.
Should I compare solar ROI by state using averages?
State averages are useful for context, but your own utility bill, local quote, roof production estimate, financing terms, and utility tariff provide a more accurate ROI estimate.
How do I calculate solar ROI for my state?
Start with your annual electricity usage, electricity rate, local solar production estimate, system quote, verified incentives, net metering rules, and financing terms. Then calculate payback period and lifetime ROI using realistic assumptions.
Conclusion
Solar ROI by state depends on more than sunlight or average installation cost.
The strongest state-level solar returns usually come from a combination of reasonable system cost, high electricity value, useful incentives, favorable utility rules, good solar production, and fair financing terms.
The weakest returns often happen when system prices are high, electricity rates are low, export credits are weak, financing costs are expensive, or roof conditions reduce production.
Use state averages only as a starting point. The better approach is to calculate solar ROI with your own utility bill, local quote, roof-specific production estimate, incentive eligibility, and financing terms.
Before comparing installer proposals, use the MySolarROI solar ROI calculator to estimate solar savings, payback period, and long-term ROI for your state and utility assumptions.