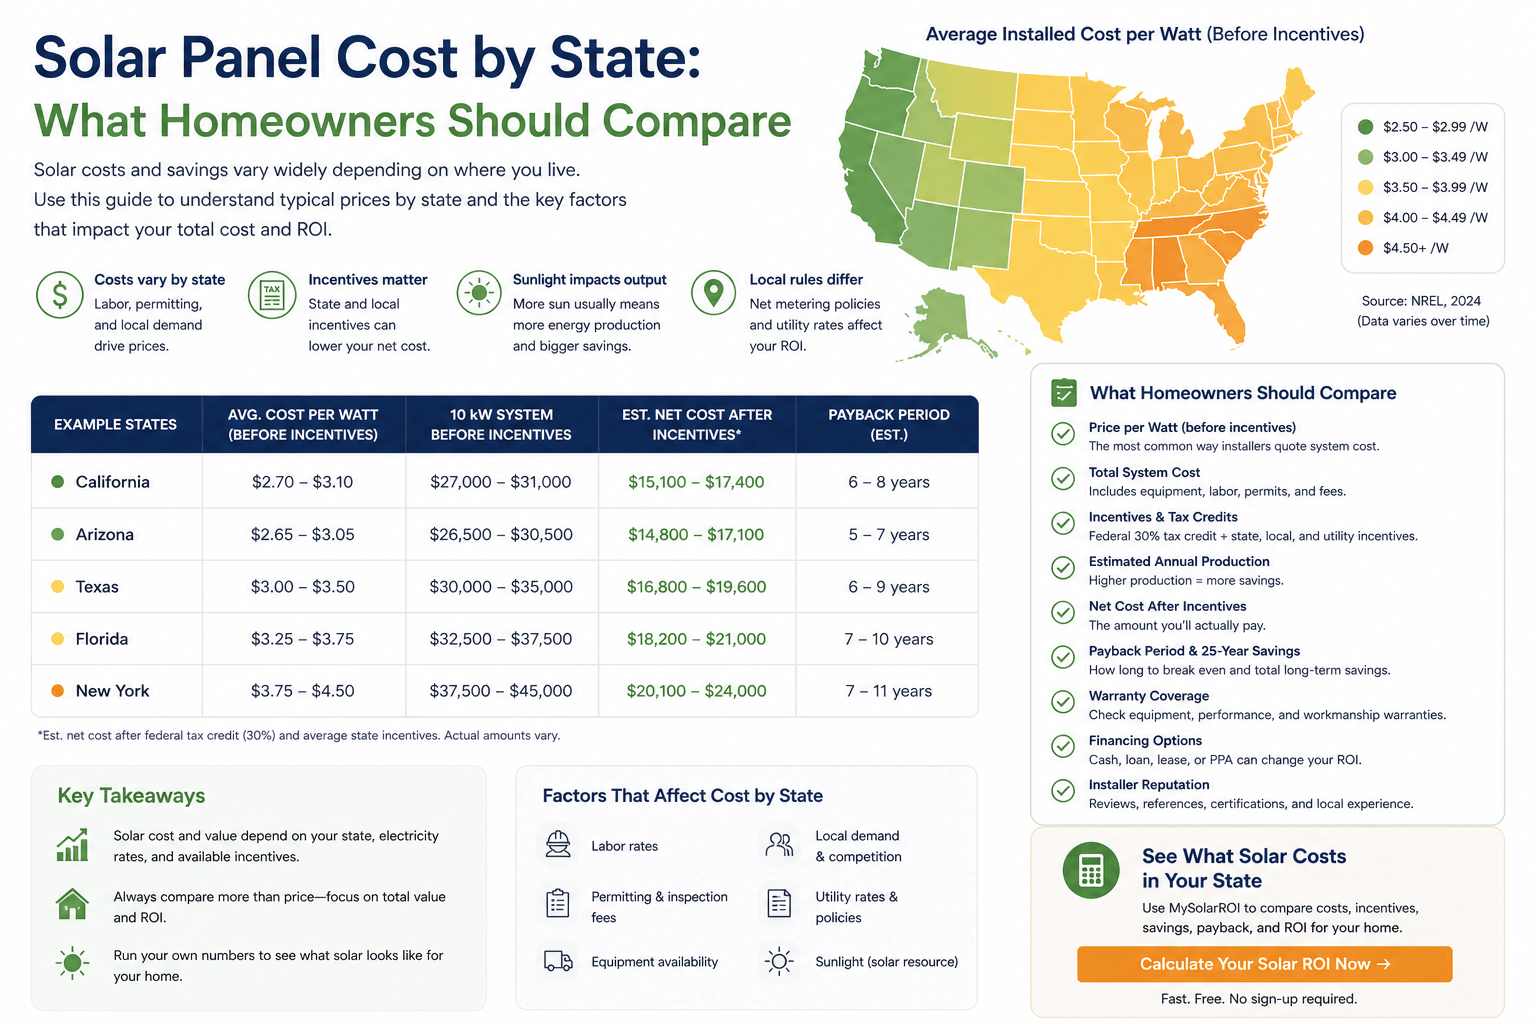
If you are researching solar panel cost by state, be careful with simple national averages.
Solar pricing changes by state, but the installed price is only one part of the decision. A state with higher solar installation costs may still have strong solar economics if electricity rates are high, incentives are useful, and net metering or solar buyback rules are favorable.
A lower-cost state may not always produce the best return if electricity is cheap, export credits are weak, or the system is oversized for the home’s usage.
This guide explains how homeowners should compare solar panel cost by state, including cost per watt, system size, electricity rates, incentives, roof conditions, financing, net metering, batteries, and payback period.
Before comparing installer proposals, use the MySolarROI solar ROI calculator to estimate how state-specific costs, electricity rates, incentives, and utility rules may affect your solar payback period and long-term ROI.
Solar Panel Cost by State: Why Prices Vary
Solar panel cost varies by state because every market has different labor costs, permitting rules, utility requirements, competition, roof types, incentive programs, and customer acquisition costs.
A state-level average can be useful for early research, but your actual quote depends on your home and your installer.
Solar cost can vary based on:
- system size
- cost per watt
- local labor costs
- installer competition
- permitting requirements
- interconnection requirements
- roof complexity
- shade and roof layout
- equipment selection
- battery storage
- main panel upgrades
- financing structure
- state, local, or utility incentives
For national context, the U.S. Department of Energy’s 2024Q1 PV cost benchmark lists a representative residential PV system at 8 kWdc with a modeled market price benchmark of $3.15/Wdc. SEIA and Wood Mackenzie reported average residential system pricing of $3.39/Wdc in Q4 2025. These are useful references, but they are not a substitute for local quotes.
What Counts as Solar Panel Cost?
Solar panel cost should include more than the panels themselves.
A full installed solar quote may include:
- solar panels
- inverter or microinverters
- racking and mounting hardware
- installation labor
- system design
- permitting
- utility interconnection
- electrical work
- monitoring equipment
- main electrical panel upgrade, if needed
- roof work directly tied to the installation
- battery storage, if included
- sales, overhead, and installer margin
Do not compare quotes only by total price. Also compare system size, equipment, warranties, annual production, financing terms, and what work is included.
| Quote Item | Why It Matters |
|---|---|
| Gross installed price | Starting price before incentives |
| System size | Shows how much solar capacity you are buying |
| Cost per watt | Helps compare quotes of different sizes |
| Estimated annual production | Shows expected electricity generation |
| Cash price | Shows base system cost without financing |
| Financed price | Shows whether loan terms increase total cost |
| Battery included? | Batteries can significantly increase cost |
| Roof or electrical work included? | Extra work can change the true project cost |
How to Compare Solar Cost Per Watt by State
Cost per watt is one of the easiest ways to compare solar quotes.
The formula is:
Cost per watt = gross installed cost ÷ system size in watts
Example:
$25,000 ÷ 7,500 watts = $3.33/W
| System Size | Gross Installed Cost | Cost per Watt |
|---|---|---|
| 6 kW | $20,400 | $3.40/W |
| 8 kW | $26,400 | $3.30/W |
| 10 kW | $32,000 | $3.20/W |
Cost per watt is useful, but it can be misleading if you ignore what is included.
For example, a quote with a higher cost per watt may include a main panel upgrade, premium equipment, better warranties, or a difficult roof. A lower quote may exclude battery storage, roof work, or required electrical upgrades.
For a broader pricing breakdown, read the solar panel cost 2026 guide.
Solar Panel Cost by State Is Not the Same as Solar Value by State
The cheapest solar state is not always the state with the best solar ROI.
Solar value depends on both cost and savings.
Electricity rates matter because solar savings usually come from reducing the electricity you buy from the utility. A state with higher electricity rates may produce stronger savings from the same solar system than a state with lower electricity rates.
According to EIA’s 2024 residential electricity data, the U.S. average residential electricity price was 16.48 cents/kWh, but state averages vary widely. EIA’s table shows much higher residential averages in places such as Hawaii and California and lower averages in many other states.
| State Factor | Why It Matters for Solar ROI |
|---|---|
| Installed cost | Determines how much you need to recover |
| Electricity rate | Determines the value of each kWh solar offsets |
| Solar production | Determines how much electricity the system can generate |
| Net metering or export credits | Determines the value of excess solar sent to the grid |
| Incentives | May reduce net cost if you qualify |
| Financing costs | Can reduce ROI through interest and fees |
This is why homeowners should compare cost, savings, and payback together.
Example: Same Solar Cost, Different State Electricity Rates
Here is a simplified example. These numbers are for illustration only and are not guaranteed.
Actual results depend on location, system design, utility rates, net metering rules, roof conditions, incentives, financing, and actual production.
| Assumption | Lower-Rate State | Higher-Rate State |
|---|---|---|
| Gross system cost | $25,000 | $25,000 |
| Verified rebate | $1,000 | $1,000 |
| Net cost before tax considerations | $24,000 | $24,000 |
| Annual solar production | 9,000 kWh | 9,000 kWh |
| Electricity value | $0.13/kWh | $0.28/kWh |
| Estimated annual value | $1,170 | $2,520 |
| Simple payback | 20.5 years | 9.5 years |
Simple payback calculations:
$24,000 ÷ $1,170 = 20.5 years
$24,000 ÷ $2,520 = 9.5 years
This example shows why state electricity rates can matter as much as installation cost. It also shows why you should not judge solar only by the sticker price.
Use the MySolarROI calculator to test your state’s electricity rate, your system cost, and your utility assumptions before comparing installer quotes.
How State Incentives Affect Solar Panel Cost
State incentives can reduce the net cost of solar, but they vary widely.
Depending on your state and utility, incentives may include:
- state solar rebates
- utility rebates
- local incentives
- state tax credits
- sales tax exemptions
- property tax exemptions
- renewable energy credit programs
- battery incentives
- special financing programs
Do not assume a state incentive applies just because it appears in a blog post or quote. Programs can change, funding can run out, and eligibility may depend on system size, equipment, utility territory, income, ownership type, installation date, and application timing.
For 2026 projects, be especially cautious with federal residential tax credit assumptions. The IRS states that the Residential Clean Energy Credit is not available for property placed in service after December 31, 2025. For current context, read the federal solar tax credit 2026 guide.
You can also review the solar tax credit calculator guide to understand how verified incentives affect payback and ROI.
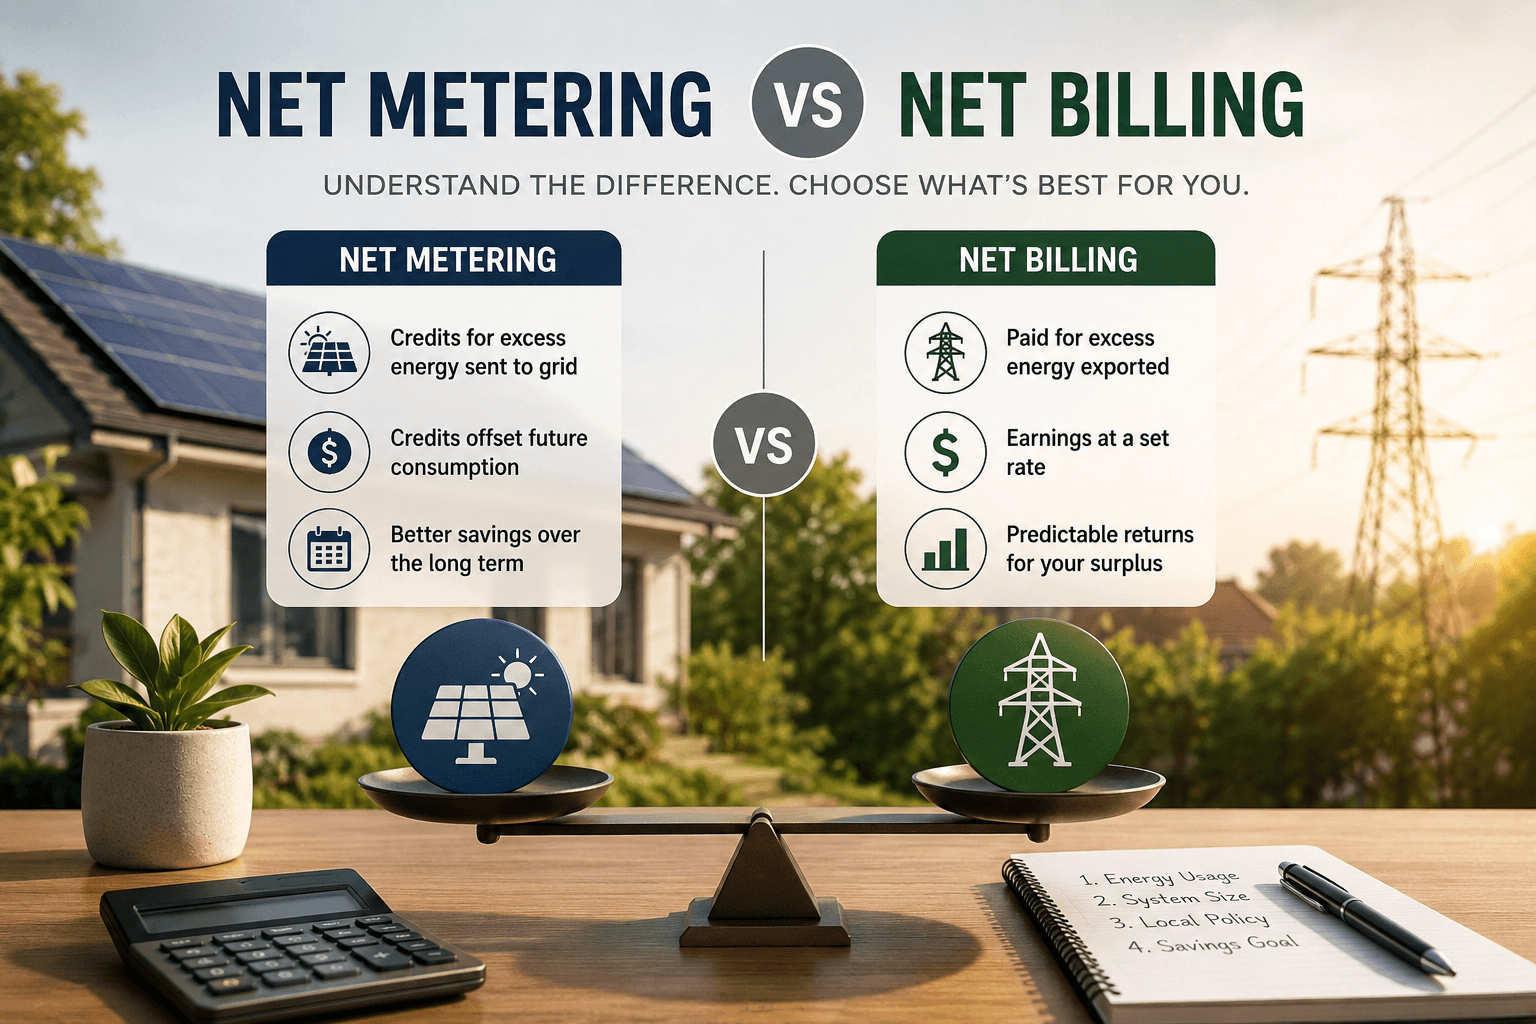
Net Metering Rules Can Change the State-by-State Math
Net metering, net billing, and solar buyback rules determine how your utility credits excess solar electricity sent to the grid.
This is a major state-by-state and utility-by-utility difference.
| Utility Rule | What It Means | Impact on Solar Value |
|---|---|---|
| Full retail net metering | Exported solar may earn credit near the retail rate | Often improves savings and payback |
| Net billing | Imports and exports are valued separately | ROI depends on the export rate |
| Avoided cost credit | Exported solar is credited at a lower utility cost-based rate | May reduce savings |
| Time-of-use export rates | Export value changes by time period | Production timing and batteries may matter more |
| Limited export credit | Extra solar may have low value | System sizing becomes more important |
A state with higher installation costs may still be attractive if electricity rates and export credits are strong. A state with lower system costs may produce weaker ROI if utility credits are low.
Read the net metering explained guide before trusting a state-level savings estimate.
Solar Cost by State: What to Compare Before Signing
When comparing solar panel cost by state, homeowners should look beyond one average price.
Use this checklist:
| Comparison Point | What to Ask |
|---|---|
| Gross installed cost | What is the total project cost before incentives? |
| Cost per watt | What is the price divided by system watts? |
| System size | Is the system sized to my actual usage? |
| Annual production | How many kWh is the system expected to produce? |
| Electricity rate | What rate is used for savings estimates? |
| Export credit | How does my utility value excess solar? |
| Incentives | Which incentives are verified? |
| Financing | What are the cash price and financed price? |
| Battery storage | Is battery cost included or separate? |
| Roof work | Are roof or electrical upgrades included? |
If one quote includes a battery and another does not, the comparison is not apples to apples. If one quote assumes full retail net metering and another uses your real utility export rate, the savings estimates will also differ.
Mini Case Study: Comparing Two State Scenarios
Here is a simplified homeowner example. These numbers are for illustration only and are not guaranteed.
Actual results depend on state, utility, roof conditions, system design, electricity rates, incentives, net metering rules, installer pricing, financing, and actual production.
| Assumption | State A | State B |
|---|---|---|
| System size | 8 kW | 8 kW |
| Gross installed cost | $25,600 | $28,000 |
| Verified state/utility incentive | $500 | $2,500 |
| Net cost before tax considerations | $25,100 | $25,500 |
| Estimated annual production | 10,000 kWh | 10,000 kWh |
| Effective electricity value | $0.14/kWh | $0.24/kWh |
| Estimated annual value | $1,400 | $2,400 |
| Simple payback | 17.9 years | 10.6 years |
Simple payback calculations:
$25,100 ÷ $1,400 = 17.9 years
$25,500 ÷ $2,400 = 10.6 years
State B has a higher gross system cost, but the estimated payback is shorter because the effective electricity value is higher and the verified incentive is larger.
This is why state-by-state solar comparisons should include both cost and value.
How Financing Changes State-by-State Solar Cost
Solar financing can change your true cost in any state.
Ask every installer for:
- cash price
- financed price
- APR
- loan term
- dealer fee
- monthly payment
- total repayment amount
- whether the loan assumes incentive paydown
A low monthly payment can hide a high total repayment amount. A state with attractive incentives can still produce weak ROI if the financed price is much higher than the cash price.
Use the solar financing comparison guide before choosing a loan, lease, or PPA.
Common Mistakes When Comparing Solar Cost by State
| Mistake | Why It Can Mislead You | Better Approach |
|---|---|---|
| Using only a national average | Local labor, permitting, and utility rules vary | Use local quotes and state-specific assumptions |
| Comparing total price without system size | A cheaper system may simply be smaller | Compare cost per watt and annual production |
| Ignoring electricity rates | Savings depend on the value of avoided electricity | Use your actual utility bill |
| Assuming all state incentives apply | Eligibility and funding may vary | Verify programs through official sources |
| Ignoring net metering changes | Export credits can reduce savings | Check your utility tariff |
| Comparing cash and financed quotes together | Financing can raise real cost | Separate cash price from financed price |
| Forgetting roof or electrical upgrades | Extra project costs can change payback | Ask what is included and excluded |
Questions to Ask Local Solar Installers
Before accepting a quote in your state, ask:
- What is the gross installed cost?
- What is the system size in kW?
- What is the cost per watt?
- What is the estimated annual production?
- What cash price and financed price are you quoting?
- What utility rate is used in the savings estimate?
- What export credit rate is assumed?
- Which incentives are included?
- Are those incentives verified or estimated?
- Does the quote include roof work?
- Does the quote include electrical panel upgrades?
- Is battery storage included or separate?
- What happens if the system produces less than estimated?
- What costs are excluded from the contract?
If an installer cannot explain the state, utility, and financing assumptions clearly, slow down before signing.
External Sources to Check
Before relying on state-by-state solar cost or savings estimates, verify assumptions with reputable sources.
- U.S. Department of Energy solar photovoltaic system cost benchmarks
- SEIA Solar Market Insight pricing and market data
- EIA average retail electricity price by state
- DSIRE incentive and policy database
- NREL PVWatts solar production calculator
- Your state energy office
- Your local utility’s current net metering, net billing, or solar buyback tariff
FAQ About Solar Panel Cost by State
Why does solar panel cost vary by state?
Solar panel cost varies by state because of differences in labor costs, permitting, interconnection rules, installer competition, equipment choices, roof types, incentives, utility requirements, and customer acquisition costs.
Which state has the cheapest solar panels?
The cheapest state depends on the data source, system size, installer market, and whether the price includes batteries, financing, roof work, and incentives. Instead of relying only on one ranking, compare local quotes by cost per watt and annual production.
Is solar worth more in states with high electricity rates?
Often, yes. Higher electricity rates can make each kWh of solar production more valuable. But ROI still depends on system cost, incentives, utility export credits, financing, roof conditions, and how much solar electricity you use at home.
Do state incentives reduce solar panel cost?
They can, but only if you qualify and the program is available. State, local, and utility incentives may have eligibility rules, funding limits, deadlines, ownership requirements, or equipment requirements.
Should I compare solar quotes by total cost or cost per watt?
Use both, but cost per watt is usually better for comparing systems of different sizes. Also compare equipment, warranties, annual production, financing, roof work, battery storage, and what is included in the contract.
Does net metering affect solar cost by state?
Net metering does not directly change the installed cost, but it can strongly affect savings and payback. If export credits are low, the same system may produce less bill savings than expected.
Are national solar cost averages accurate for my home?
National averages are useful for context, but your home’s quote depends on local installer pricing, roof conditions, system size, equipment, permitting, utility rules, financing, incentives, and battery options.
How do I estimate solar cost in my state?
Start with local quotes, calculate cost per watt, verify incentives, check your electricity rate, review utility export credit rules, and estimate payback using your actual usage and system production assumptions.
Conclusion
Solar panel cost by state is useful to research, but it should not be the only number you compare.
The real question is how state-specific costs, electricity rates, incentives, utility rules, system production, financing, and roof conditions work together for your home.
A state with higher installed costs may still produce stronger solar ROI if electricity rates are high and export credits are favorable. A state with lower installed costs may produce weaker returns if savings are limited or financing costs are high.
Before comparing installer quotes, use the MySolarROI solar ROI calculator to estimate solar savings, payback period, and long-term ROI using your state, utility, cost, incentive, and financing assumptions.